- The Matchday Digest
- Posts
- Premier League - Gameweek 12
Premier League - Gameweek 12
Gameweek 12 Preview, Title Race Projections and MORE!
Aaron Warburton
November 22, 2025
In partnership with
Welcome to The Matchday Digest!
The Gold standard for AI news

AI keeps coming up at work, but you still don't get it?
That's exactly why 1M+ professionals working at Google, Meta, and OpenAI read Superhuman AI daily.
Here's what you get:
Daily AI news that matters for your career - Filtered from 1000s of sources so you know what affects your industry.
Step-by-step tutorials you can use immediately - Real prompts and workflows that solve actual business problems.
New AI tools tested and reviewed - We try everything to deliver tools that drive real results.
All in just 3 minutes a day
Gameweek 12 Preview and Projections
Title Race
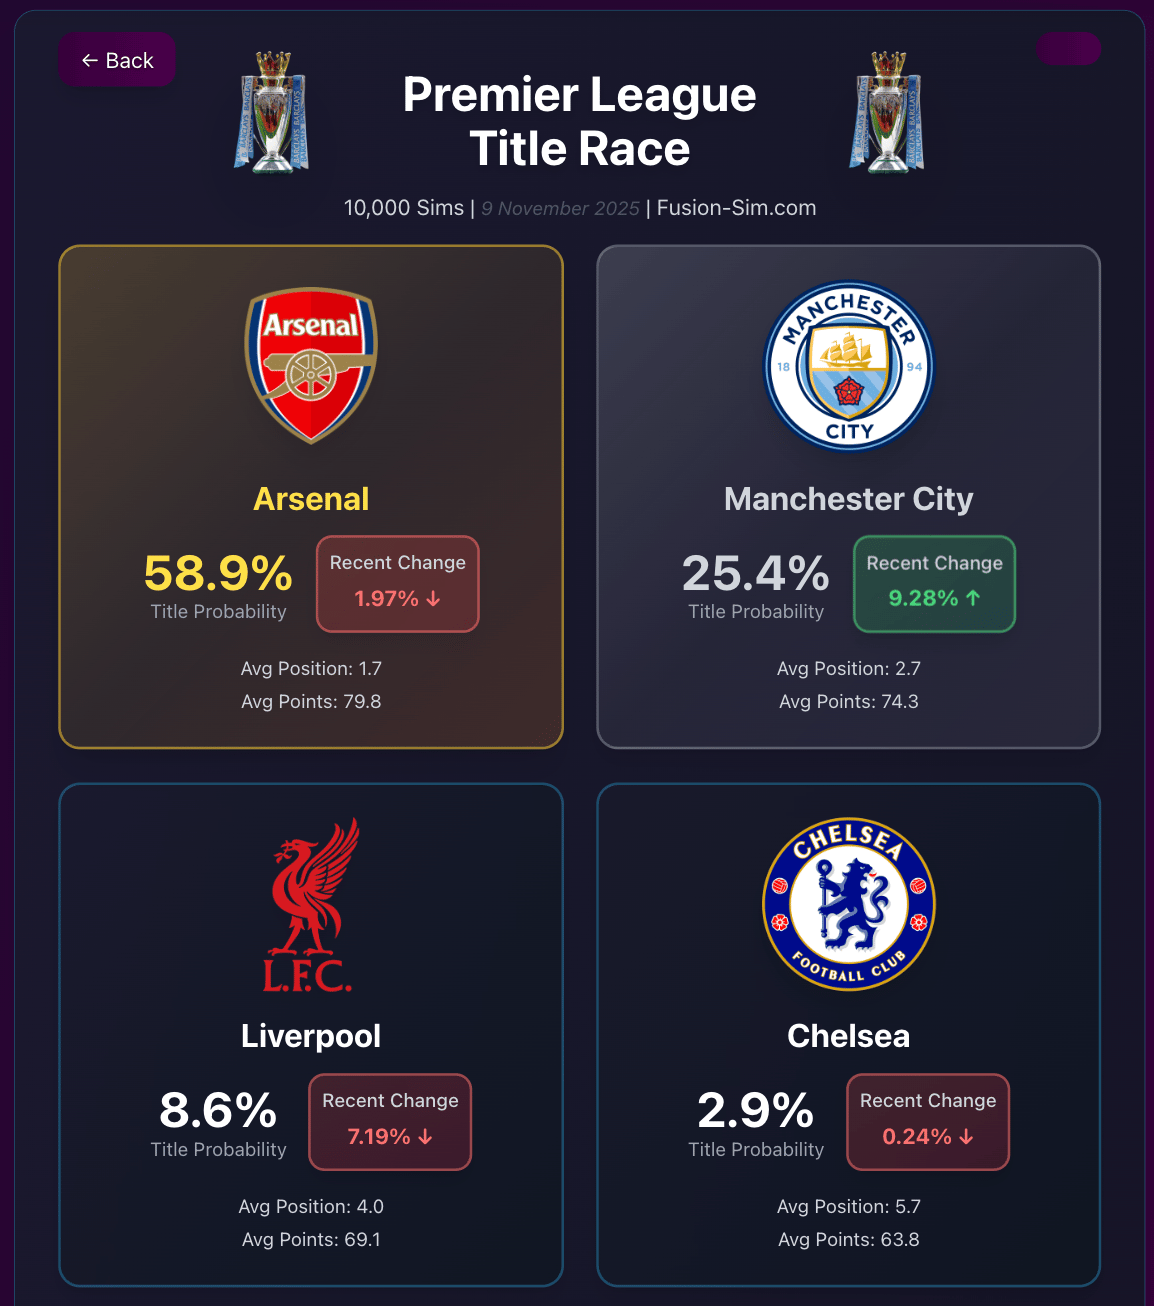
Even though it seems like an age ago since Sunderland got that draw against Arsenal, which actually in the end only cost them around 8.9% in the Premier League Title Race. The 1.97% fall you see in the image above was the drop after the Liverpool vs Man City game.
Crazy to think that Liverpool 5 games in were sitting pretty on 15 points and were nearing a similar title percentage as Arsenal are now. How times can change.
Are Man City back in the title race?
Relegation Battle
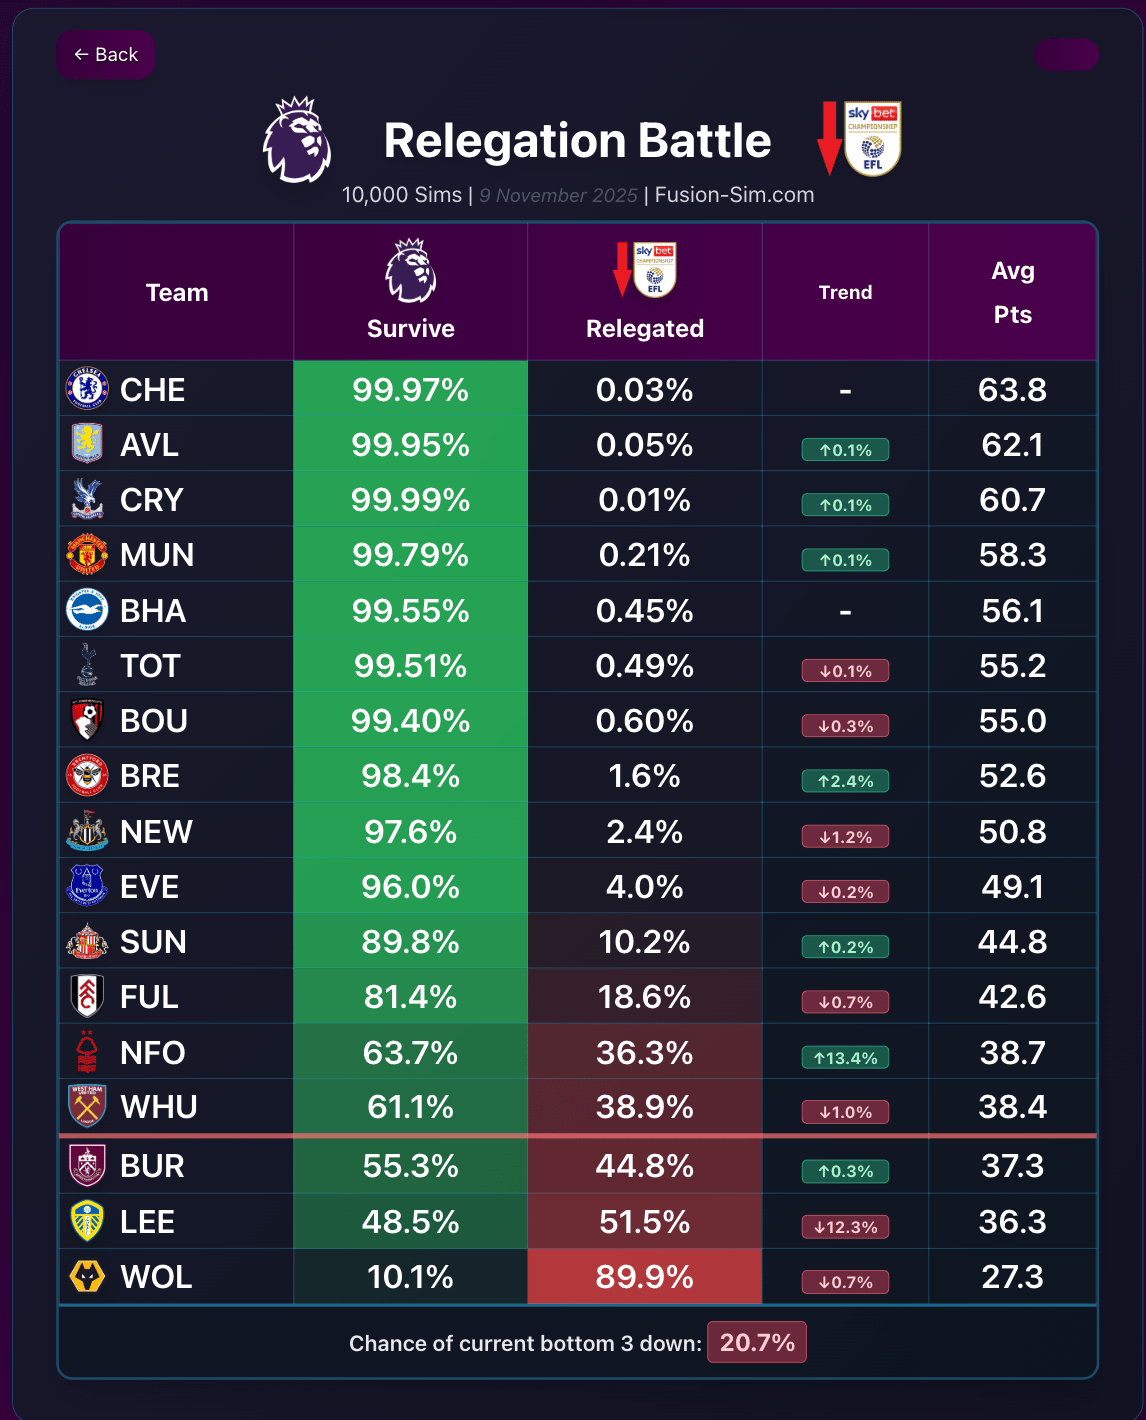
Since it’s been a while, I thought to include the full Premier League relegation battle so you can even see the handful of times that Chelsea have been relegated from the Premier League.
Apart from Wolves looking a shoo-in to be relegated, you can see how far from over it is, with the chance of the current 3 most likely teams all being relegated is just 20.7%.
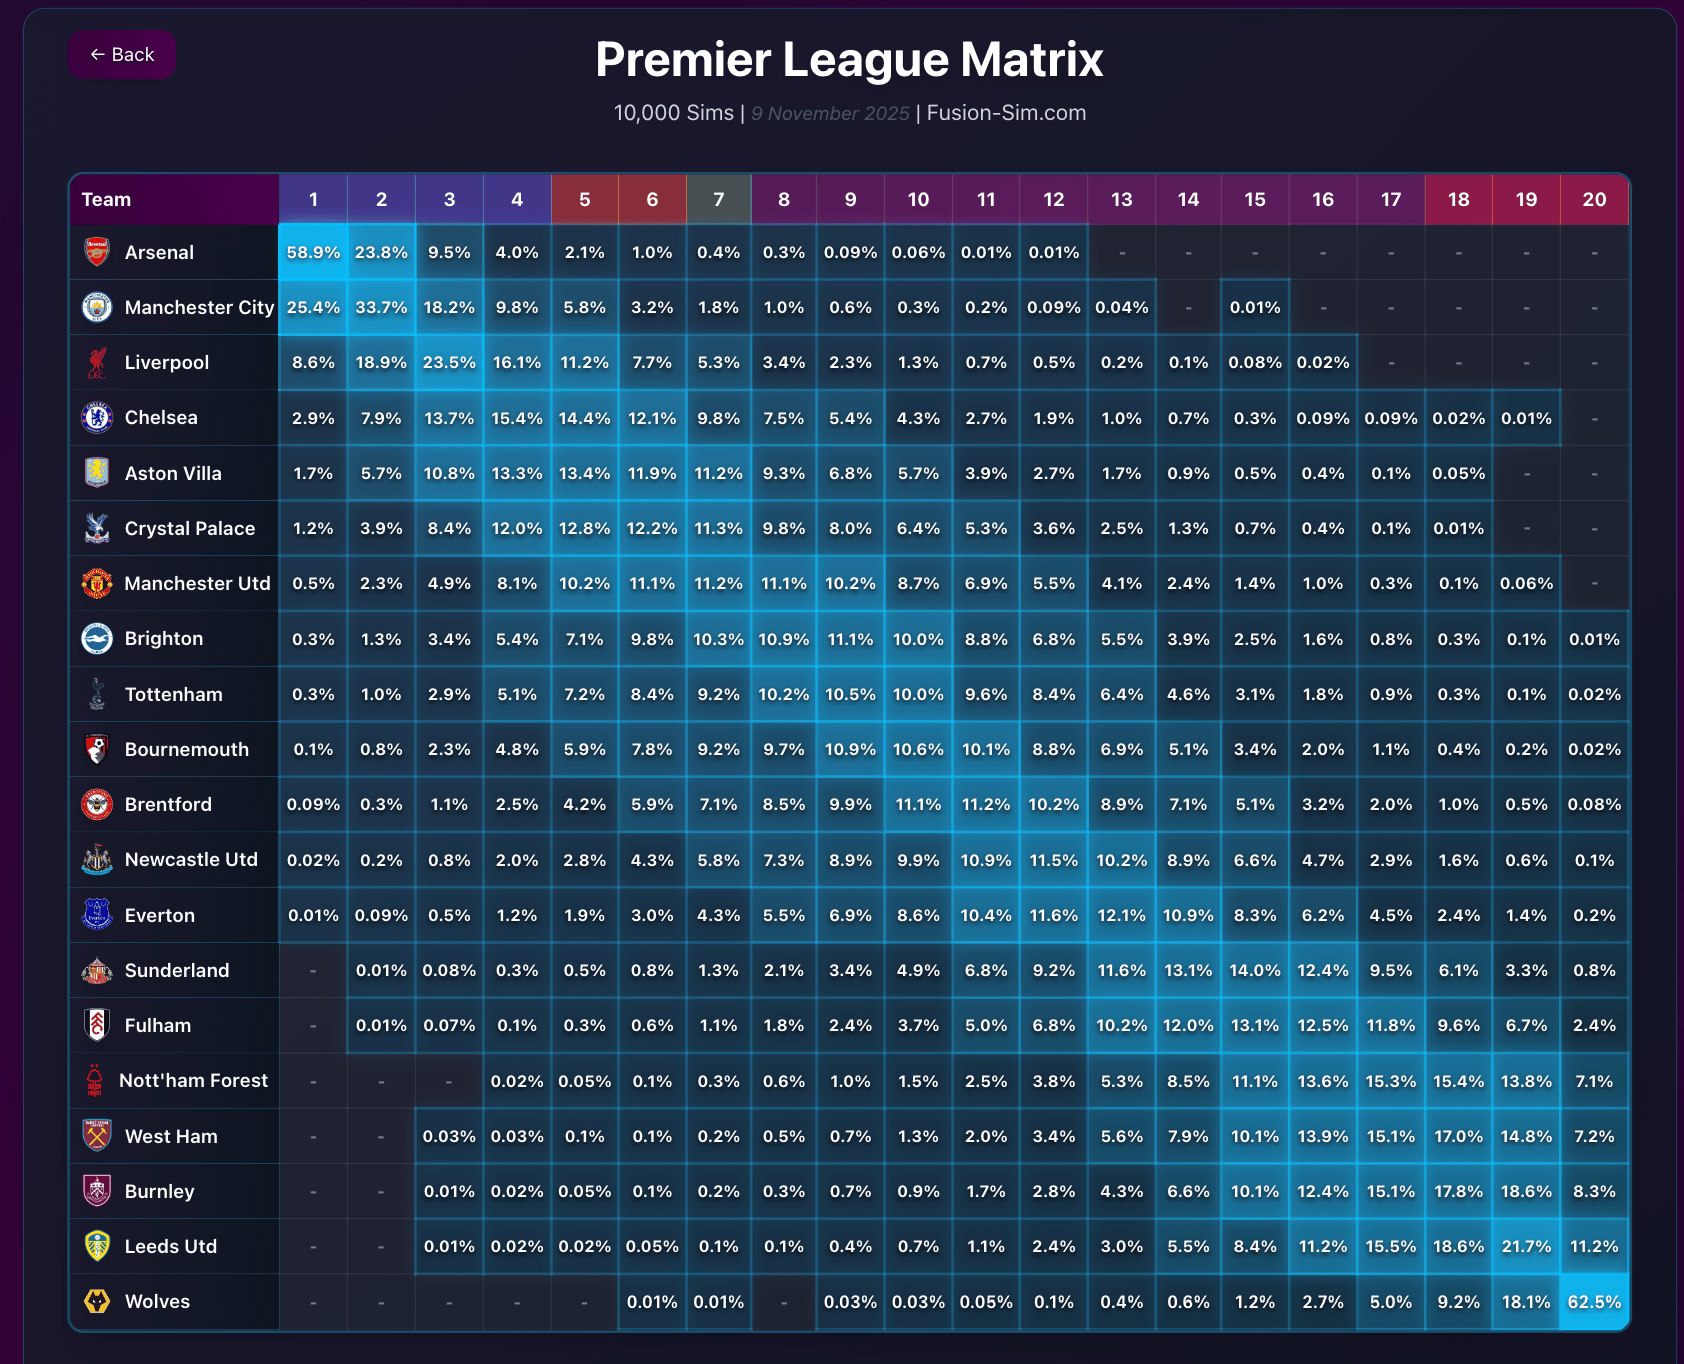
Matrix & Average Table
If you have not seen the Matrix before, or I have never explained it, it shows the chance of every team finishing in each position over 10,000 simulations of the Premier League’s remaining games.
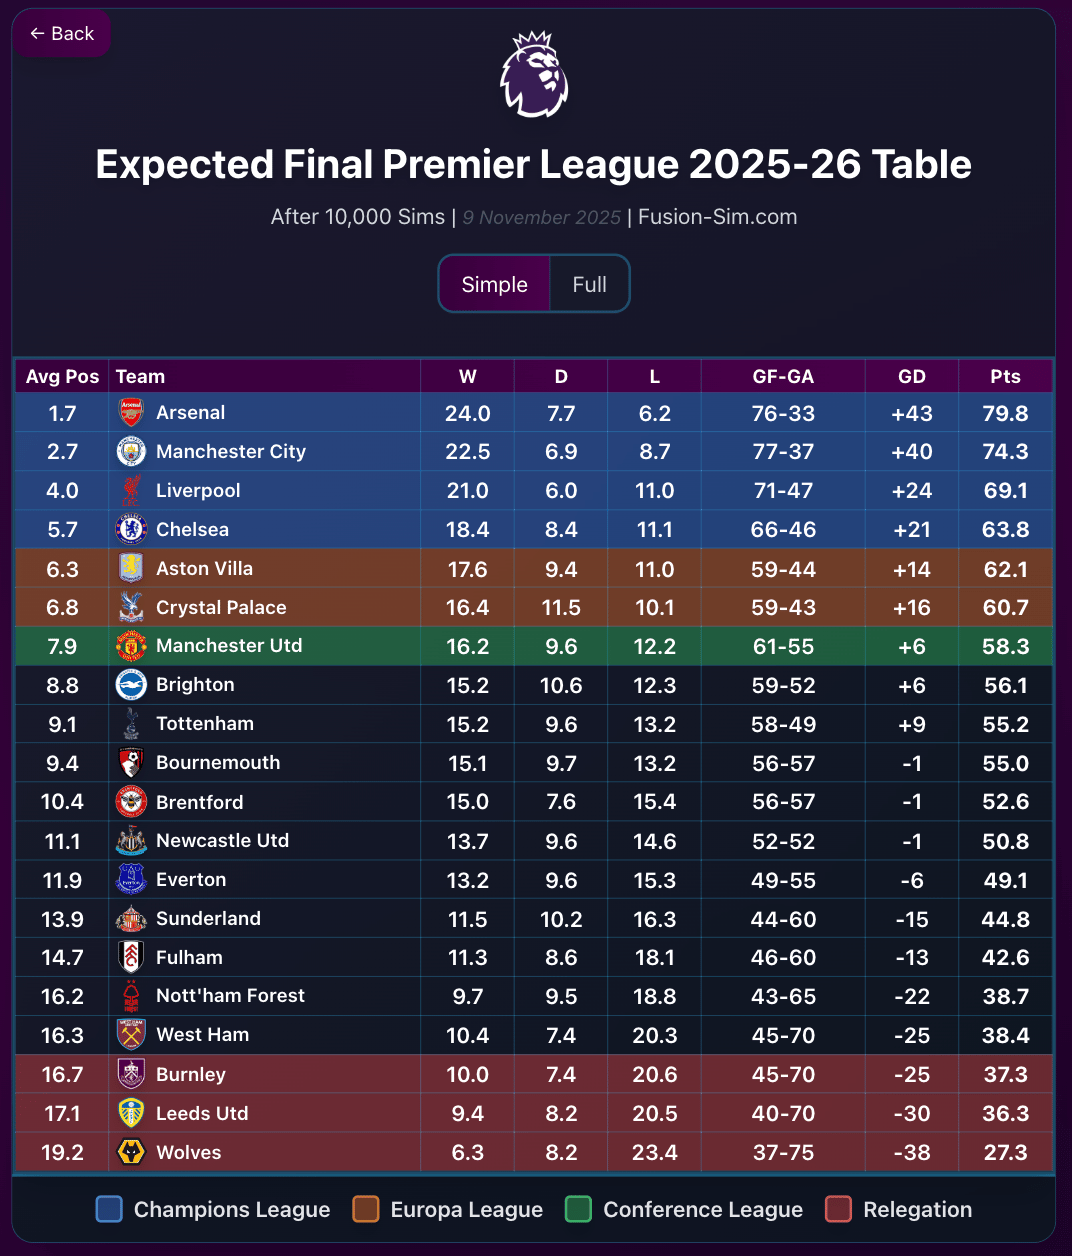
The average table is similar to that, but we just show the same data in a table-like form to get a look at what you could call the expected final standings based on everything we know right now.
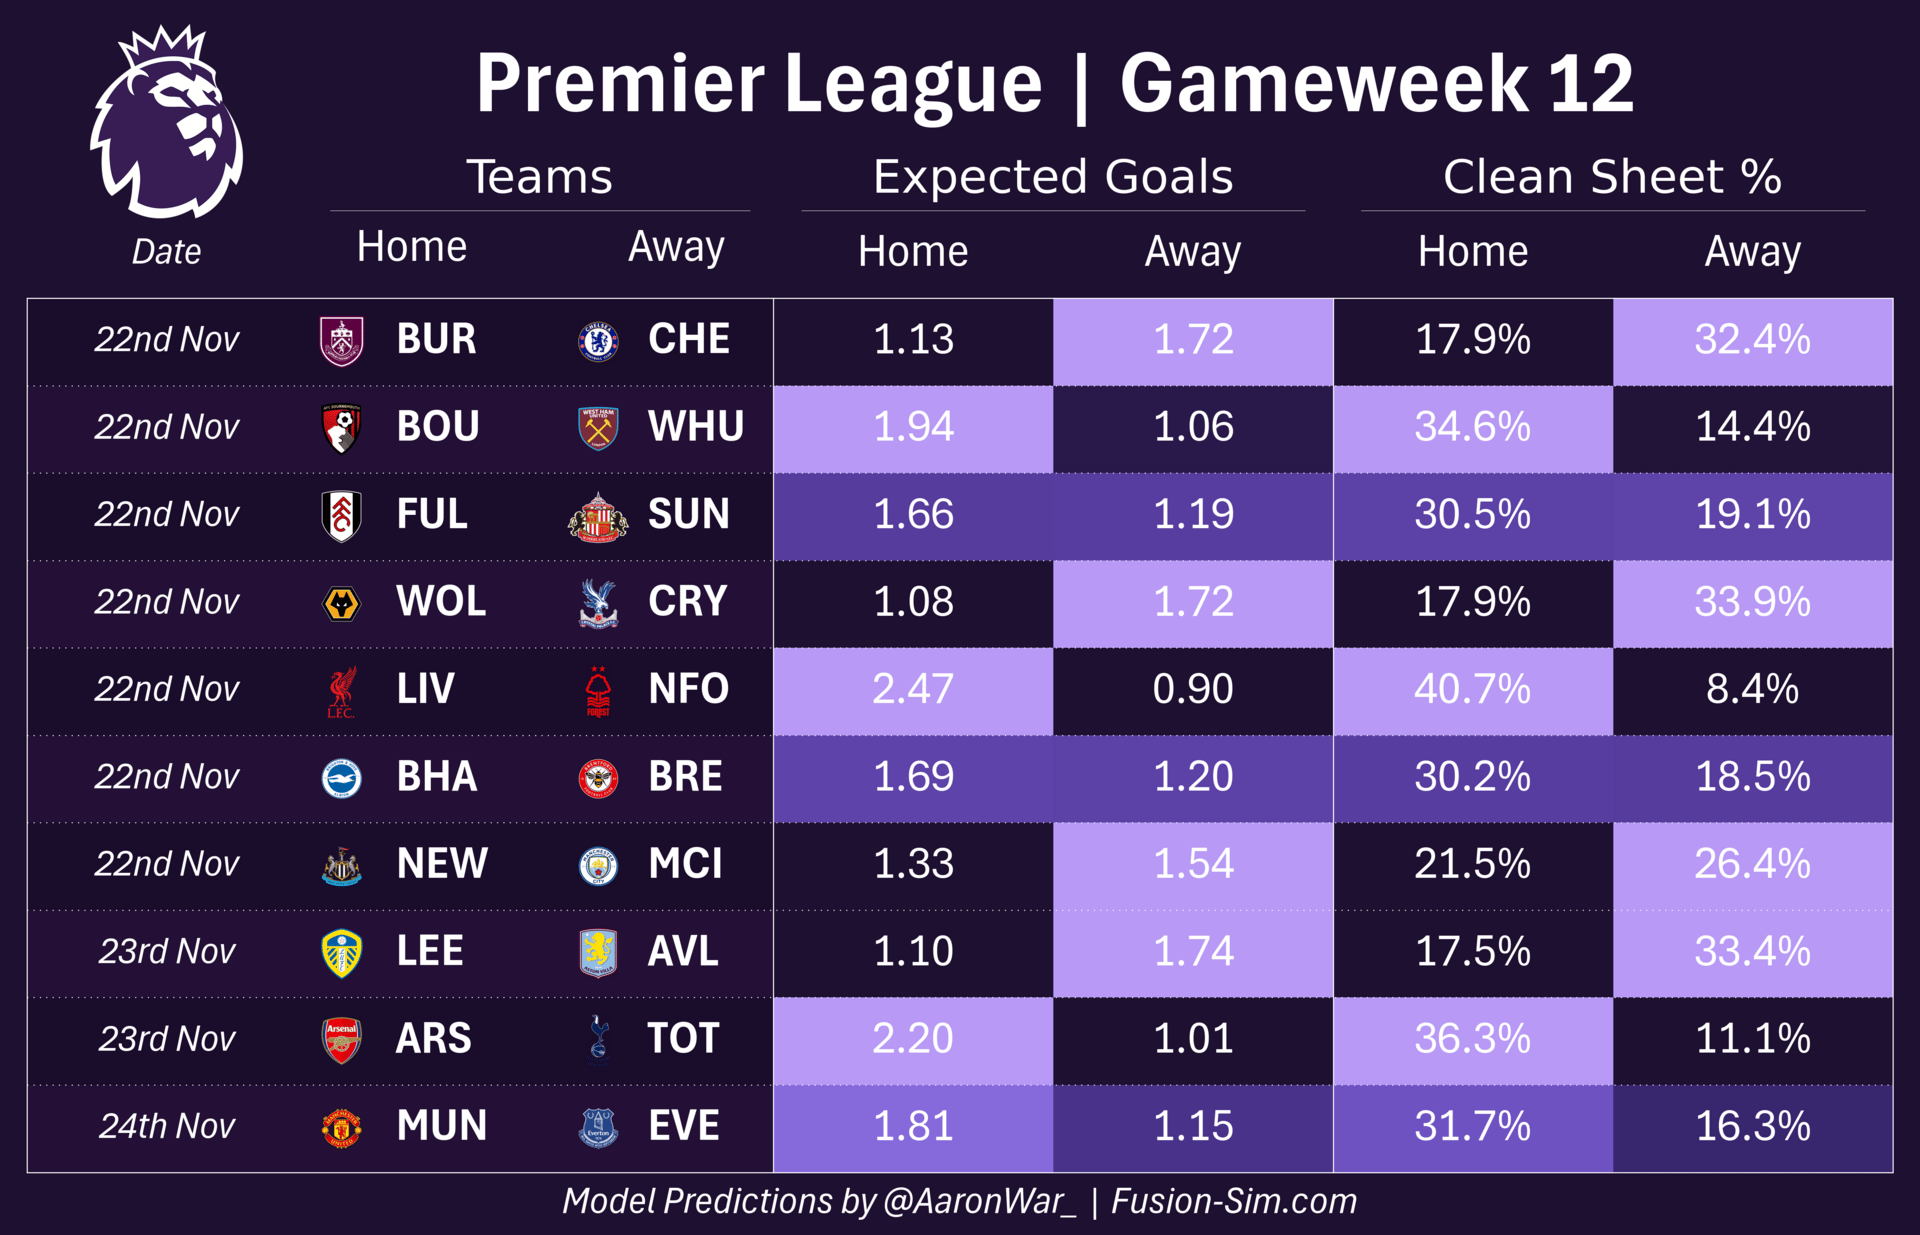
How does the Fusion-Sim 2.0 Model see Gameweek 12
Here we see a condensed look at how the model sees gameweek 12. The expected goals are the average number of goals across 10,000 simulations of that game, where each team scored. The clean sheet percentage is, of course, the number of those 10,000 in which they conceded 0 goals as a percentage.
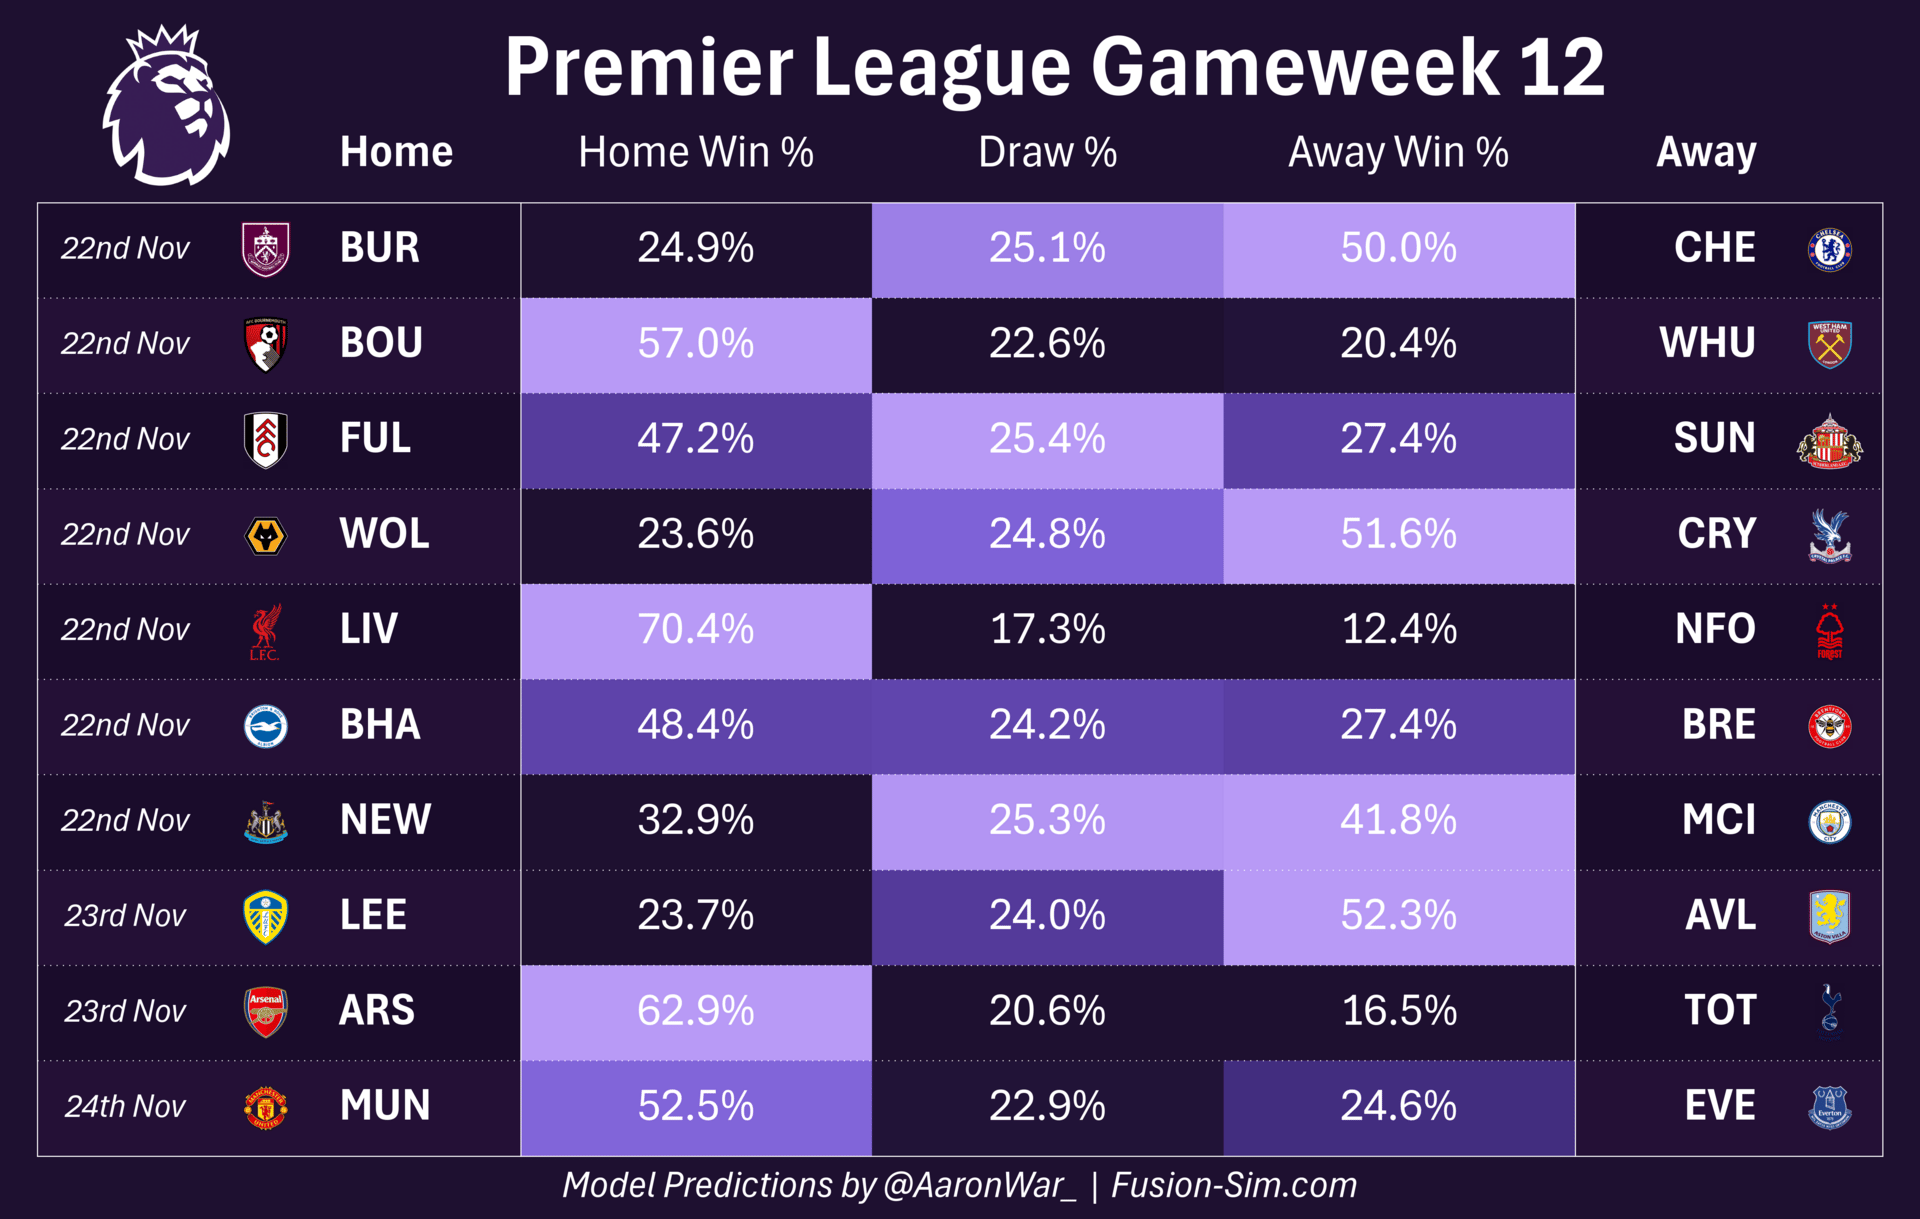
Then this table shows how based on those 10,000 simulations of each game, how many times did the game end in a home win, away win or a draw.
And finally, just for Manchester United fans, check out Back to Carrington below!
Match Reviews and Form & Trends all stat-based too
|
That’s all for this week, thanks for reading!
— Aaron.